If you're a Tamil Nadu resident watching your TNEB electricity bill climb month after month, you're not alone. The escalating costs aren't random—they're the result of five critical factors working together to drain your wallet. This comprehensive analysis reveals why your home solar energy bills are rising and how solar panels for your home can provide the ultimate solution: energy independence.
Section 1: The Regulatory Shockwave - TNEB Tariff Mechanics and Non-Linear Pricing
🎯 Reason 1: The Tariff Slab Trap
The Progressive Tariff System That Penalizes Higher Usage
1.1. Decoding the Bi-Monthly Billing Cycle and the Progressive Principle
The fundamental mechanism driving disproportionate increases in residential electricity bills issued by the Tamil Nadu Electricity Board (TNEB) is the structure of its progressive tariff system, which operates on a bi-monthly cycle. Residential consumption is measured over a 60-day period. While the tariff rates are determined by the Tamil Nadu Electricity Regulatory Commission (TNERC) and recently revised (effective July 2024), the financial consequence of this structure remains severe for high-consumption users.
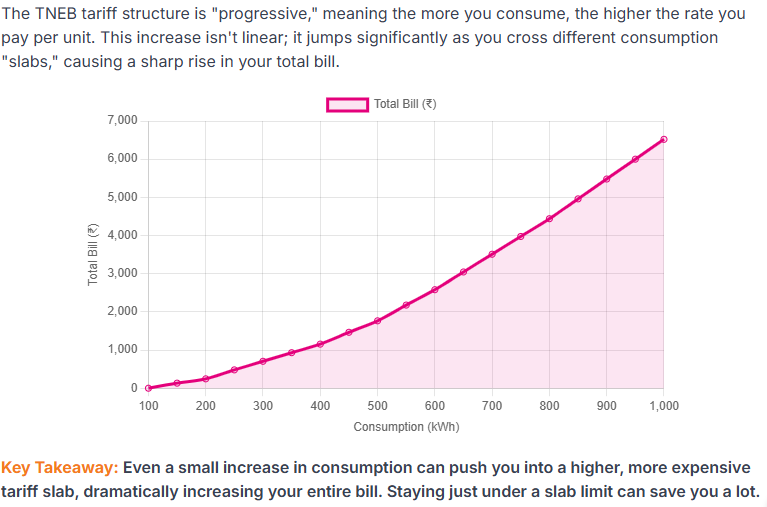
The TNEB tariff structure is "progressive," meaning the more you consume, the higher the rate you pay per unit. This increase isn't linear: it jumps significantly as you cross different consumption "slabs," causing a sharp rise in your total bill.
The system is designed to promote energy conservation by significantly increasing the rate per unit (kWh) as total consumption crosses predetermined thresholds, effectively penalizing high usage. For domestic consumers, the state government offers crucial subsidies, particularly ensuring that the first 100 units consumed bi-monthly are heavily subsidized or free. However, this benefit is quickly diminished once usage enters higher consumption blocks.
1.2. Deeper Analysis: The Exponential Financial Shock of Slab Jumping
The true financial shock of the TNEB system lies in the non-linear increase in unit cost when consumption crosses critical thresholds. Based on the revised post-July 2024 tariffs, the progression of rates transforms minor increases in consumption into disproportionate financial burdens.
Financial Impact of TNEB Progressive Tariff Slabs (Bi-Monthly)
| Bi-Monthly Consumption (Units) | Applicable Slab Rate (Approx. Post-Subsidy) | Significance |
|---|---|---|
| 0 - 100 | ₹0.00 | Free/Subsidized (Baseline) |
| 101 - 200 | ₹2.35 | Low Rate Tier |
| 201 - 400 | ₹4.70 | Moderate Rate Tier |
| 401 - 500 | ₹6.30 | Critical Jump |
| Above 500 (e.g., 501-600) | Higher Tier Rate (Approaching ₹8.00+) | Exponential Cost Escalation |
💡 Key Insight: The Slab Jump Penalty
A household consuming 400 units versus one consuming 501 units shows that the difference of just 101 units in consumption can lead to a 50% or greater increase in the final bill amount. This demonstrates how small incremental usage can trigger massive cost increases.
Section 2: Consumption Dynamics - Baseline Creep, Legacy Loads, and Environmental Stressors
🌡️ Reason 2: Seasonal Stress - Peak Cooling Loads
Tamil Nadu's Climate Creates Massive Summer Consumption Spikes
2.1. Seasonal Stress: Peak Cooling Loads
The tropical climate of Tamil Nadu ensures that heating, ventilation, and air conditioning (HVAC) systems are the single largest power consumers in an average household. The annual summer heat initiates a massive, predictable surge in demand. Tamil Nadu has frequently registered record-high electricity demand, hitting 19,409 MW, with expectations that peak summer demand could exceed 21,000 MW.
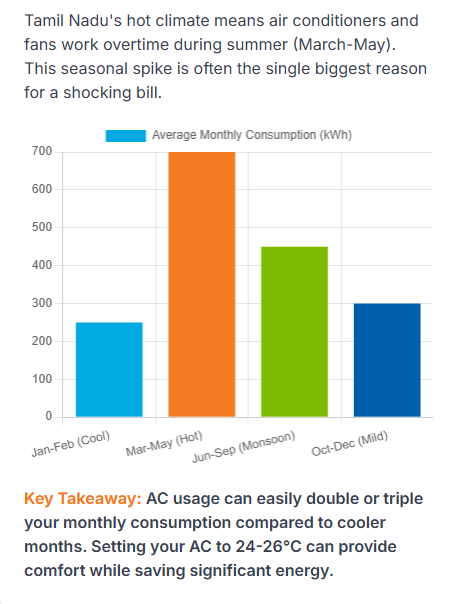
Tamil Nadu's hot climate means air conditioners and fans work overtime during summer (March-May). This seasonal spike is often the single biggest reason for a shocking bill.
Analysis of consumption patterns confirms that homes utilizing air conditioners experience a sharp increase in consumption during the summer months (typically March through June), correlating precisely with the rise in outdoor temperature. This spike often starts earlier than anticipated, with officials noting the surge beginning in January and accelerating through March and April.
⚡ Reason 3: Legacy Load - Appliance Inefficiency
Old, Inefficient Appliances Drain Power Continuously
2.2. Legacy Load: Appliance Inefficiency
The baseline consumption—the electricity used before the seasonal AC spike—is inflated by inefficient legacy appliances, effectively eliminating the buffer needed to stay in lower tariff bands. High baseline consumption is often driven by "The Big Three" continuously operating appliances:
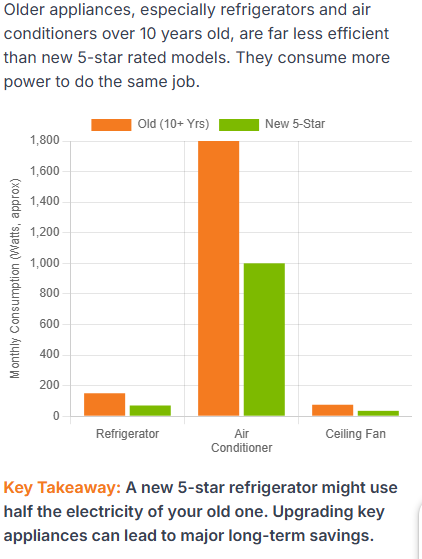
Older appliances, especially refrigerators and air conditioners over 10 years old, are far less efficient than new 5-star rated models. They consume more power to do the same job.
- Water Heaters: These are significant energy drains, especially during high-use periods. An average water heater consumes approximately 180 kWh of electricity per month.
- Refrigerators: Running 24 hours a day, the average unit consumes 30–40 kWh per month, though this figure is dependent on the appliance's age, size, ambient temperature, and frequency of use.
- HVAC Systems: While primarily seasonal, they are the largest power consumers overall, and their long-term efficiency is critical.
🧛 Reason 4: Continuous Drain - Phantom Power Consumption
Hidden "Vampire Load" Silently Adds Units to Your Bill
2.3. Continuous Drain: Phantom Power Consumption
Phantom load, also known as standby power, vampire energy, or ghost power, represents the hidden, continuous drain that silently adds units to the overall bi-monthly total. This phenomenon occurs when electronic or electrical appliances consume electricity even when switched off or in standby mode, such as plugged-in chargers, TVs, and set-top boxes.
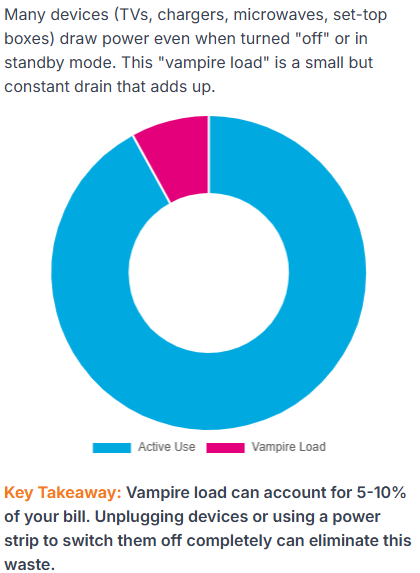
Many devices (TVs, chargers, microwaves, set-top boxes) draw power even when turned "off" or in standby mode. This "vampire load" is a small but constant drain that adds up.
Studies estimate that standby power accounts for 5–10% of a household's total electricity use. In unit terms, this drain can contribute 100–150 units annually to the meter reading. Financially, this equates to an estimated annual waste of ₹1,500–₹3,000 for an average Indian home.
⚠️ The Perfect Storm
The convergence of Legacy Load (Reason 3) and Phantom Power (Reason 4) creates an elevated baseline consumption that ensures high usage households start their bi-monthly cycle 40 to 70 units higher than necessary. When the acute Seasonal Spike (Reason 2) is added, this elevated baseline almost guarantees crossing the critical 400 or 500-unit boundary (Reason 1).
Section 3: Strategic Mitigation and Immediate Cost Reduction
3.1. Proactive Slab Management and Behavioral Strategies
The most immediate and effective defense against the non-linear tariff shock is active consumption monitoring. Consumers should track their meter reading daily or weekly to project the bi-monthly total and ensure they stay below critical thresholds, particularly 400 and 500 units.
Immediate Action Steps
- Monitor Consumption: Track meter readings daily/weekly
- Target High-Wattage Appliances: Focus on water heaters, ACs, and refrigerators
- Eliminate Phantom Load: Use power strips and unplug idle devices
- Optimize AC Usage: Clean filters, improve insulation, set higher thermostats
3.2. Investment Roadmap: Calculating Appliance ROI
Investment in high-efficiency appliances should prioritize the replacement of the oldest and most frequently used high-consumption devices, particularly refrigerators and AC units. While new 5-star appliances have a higher upfront cost, this is recouped through consistent avoidance of the highest tariff slabs.
Section 4: Structural Solution - Achieving Energy Independence via Solar PV
💰 Reason 5: Opportunity Cost of Non-Adoption
Every High TNEB Bill Represents Lost Opportunity for Energy Independence
4.1. The Financial Drain of Non-Adoption
The fifth critical reason residential bills remain high is the financial opportunity cost associated with remaining fully dependent on the TNEB grid. Every substantial TNEB bill represents revenue perpetually lost to utility dependence, a cost that solar generation adoption could have mitigated. Non-adoption guarantees perpetual exposure to unpredictable tariff increases and acute seasonal consumption spikes.
Installing a residential solar PV system can lead to significant annual savings, estimated to range from ₹25,000 to ₹60,000 per year, depending on the system size. The primary benefit is achieving "Free Electricity up to 300 units per month" under the Central Government's flagship scheme, the PM Surya Ghar Muft Bijli Yojana.
4.2. Understanding the TNEB Solar Ecosystem
Tamil Nadu utilizes a Net Metering mechanism for residential solar consumers connected to the grid. This system measures the energy imported from the TNEB grid against the energy exported back to the grid. If the imported energy exceeds the exported energy, the consumer is billed according to the standard TNEB tariff structure. Crucially, if the energy exported exceeds the energy imported, the surplus is adjusted or compensated as per policy, structurally shielding the consumer from the progressive tariff penalty.
4.3. Leveraging Subsidies: PM Surya Ghar Muft Bijli Yojana
The massive Central Financial Assistance (CFA) provided under the PM Surya Ghar scheme, launched in February 2024, drastically reduces the upfront capital required and accelerates the ROI period for homeowners.
PM Surya Ghar Subsidy Structure
- 1 kW system: ₹30,000 subsidy
- 2 kW system: ₹60,000 subsidy
- 3 kW and Above: ₹78,000 subsidy (maximum limit)
System Sizing Recommendations
- 0–150 units per month: 1–2 kW capacity
- 150–300 units per month: 2–3 kW capacity
- Above 300 units per month: Above 3 kW capacity
Residential Solar PV Viability in Tamil Nadu (Post-CFA)
| System Capacity | Average Monthly Consumption (Units) | Estimated Gross Price (₹) | PM Surya Ghar Subsidy (₹) | Net Cost (₹) |
|---|---|---|---|---|
| 1 kW | 0 – 150 | ₹65,000 – ₹75,000 | ₹30,000 | ₹35,000 – ₹45,000 |
| 2 kW | 150 – 300 | ₹1,30,000 – ₹1,50,000 | ₹60,000 | ₹70,000 – ₹90,000 |
| 3 kW | 300+ | ₹1,95,000 – ₹2,25,000 | ₹78,000 | ₹1,17,000 – ₹1,47,000 |
Section 5: Conclusion and Immediate Action Plan
5.1. Synthesis of the Five Reasons
The escalating residential TNEB bill is not a random event but the predictable outcome of five interlocking factors: the acute Seasonal Spike (R2) and high Baseline Consumption driven by Legacy Load (R3) and Phantom Power (R4) colliding with the non-linear, bi-monthly Tariff Structure (R1). This financial burden is compounded by the Opportunity Cost of Non-Adoption (R5), which ensures perpetual exposure to grid dependence and future tariff escalations.
5.2. Immediate Consumer Action Checklist
Your Action Plan
- Monitor Consumption: Begin daily or weekly tracking of the electricity meter reading to anticipate and proactively manage usage
- Mitigate Baseline Draw: Eliminate phantom load by utilizing power strips and switching off electronics completely when not in use
- Maintain and Upgrade: Immediately service AC units, cleaning coils and filters to restore efficiency
- Invest in Generation: Initiate the process for solar installation by registering on the PM Surya Ghar National Portal
5.3. Final Call to Action
The evidence demonstrates that internal efficiency measures alone are insufficient to combat the structural penalty of the progressive tariff system when coupled with high seasonal demand. The pathway to permanent cost reduction lies in shifting from being a subject of regulatory tariffs to an energy producer. Leveraging the substantial PM Surya Ghar subsidy provides the financial leverage necessary to install a grid-tied rooftop solar system, offering insulation against rising tariffs and transforming high usage into mitigated consumption.
🌟 Indovolt Energy Solutions: Your Path to Energy Independence
Don't let TNEB's escalating tariffs drain your finances. Indovolt Energy Solutions is your trusted partner in achieving energy independence through professional solar installation.
Why Choose Indovolt for Your Solar Journey?
✅ Government Certified Excellence
- PM Surya Ghar approved vendor
- Government-certified engineers
- 100% subsidy support up to ₹78,000
- End-to-end project management
🎯 Comprehensive Solutions
- Free site assessment and system design
- TNEB net metering setup
- 25-year performance warranty
- Ongoing maintenance support
Break Free from the TNEB Cost Escalator
Indovolt Solar Benefits
💰 Financial Freedom
- Eliminate tariff slab penalties
- Lock in energy costs for 25 years
- Generate income through net metering
- 3-4 year payback period
🌱 Environmental Impact
- Reduce carbon footprint by 1,500 kg CO₂ annually
- Support India's clean energy mission
- Sustainable energy for future generations
- Zero pollution power generation
🏠 Property Enhancement
- Increase property value by 3-4%
- Modern, tech-savvy home image
- Energy-efficient living
- Future-ready infrastructure
Real Customer Success Story
⭐ Case Study: Coimbatore Homeowner
Before Solar: ₹4,500 bi-monthly TNEB bill (450 units)
After 3kW Indovolt Solar: ₹200 bi-monthly bill (net metering surplus)
Annual Savings: ₹25,800
System Cost: ₹1,80,000 - ₹78,000 subsidy = ₹1,02,000
Payback Period: 3.9 years | 25-Year Savings: ₹12+ lakhs
Get Started Today
Ready to Escape the TNEB Cost Escalator?
Join thousands of Tamil Nadu homeowners who've achieved energy independence with Indovolt